
Creating a Gantt Chart in MS Excel
To create a Gantt chart from scratch go to this link at microsoft.com and follow the instructions
http://office.microsoft.com/en-au/excel/HA010346051033.aspx
To use the Gantt chart generator (I created it using the microsoft instructions and customised it)
download Gantt chart generator
The downloaded file will generate a chart which looks like this:
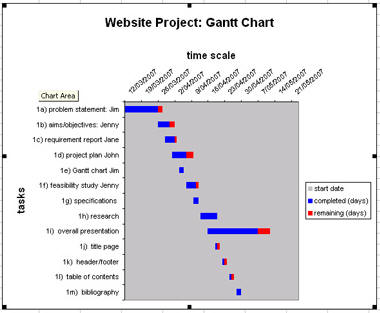
A sample set of tasks have been entered. Change the tasks in column A and the chart will auto update
completed + remaining shows the total time allocated to each task (in days). 'Remaining' indicates the time needed to finish the task
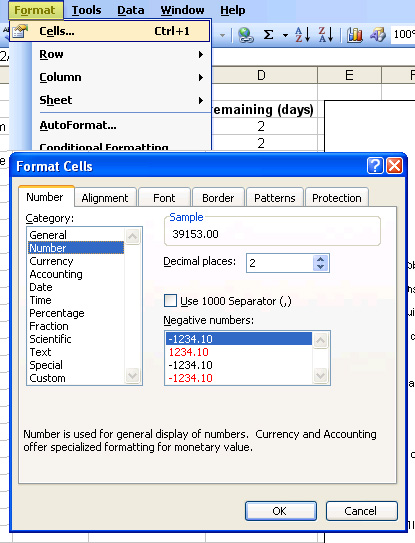
- To change the start date, enter the new date, select format. On the number tab, change date to number and make a note of the sample number (here it is 39153.00). Click cancel and return to the excel worksheet
- Click on the time scale value axis.
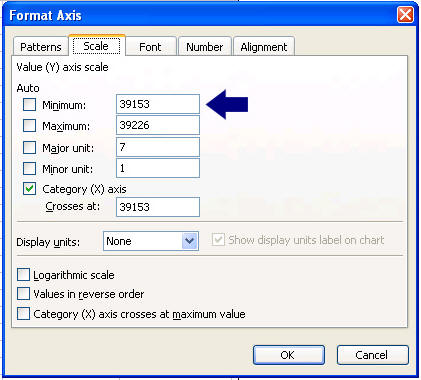
- On the scale tab, change the minimum value to the number you noted in step 1.
You may also want to change the names (Jim, Jenny, Jane & John) to the members of your project team...
- to include more tasks, you will need to edit the data range
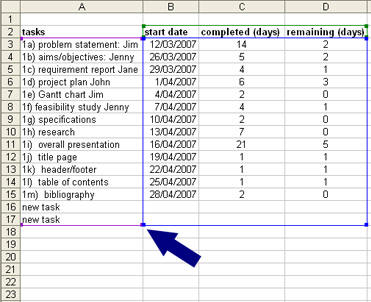
Click on the chart to select it as in the image above. A blue box will appear around the data table in columns A-D
- Click on a handle on the blue selection box and drag down, then enter new tasks as required
Use the same procedure to eliminate tasks from the list, except you must drag the blue box upwards
